
Power BI for manufacturing joins ERP, MES, machine and quality data into dashboards that show how your plants really perform. Hoist DigiSoft builds the pipelines, data model and secure Power BI reports for OEE, scrap and yield, downtime, cost per unit and on-time-in-full, from the plant floor view up to leadership.
Why Don’t Manufacturing Numbers Match?
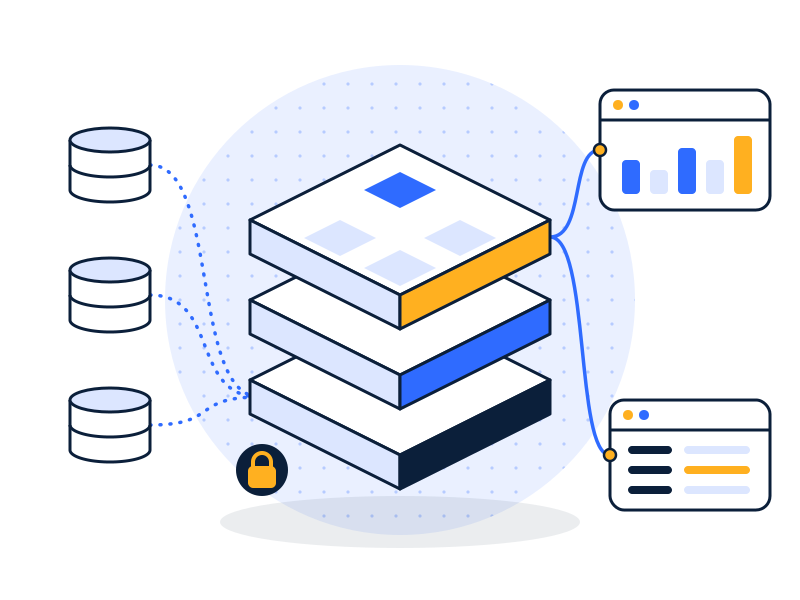
The ERP knows the plan: orders, routings, standard costs. The floor knows what actually happened: when the line stopped, how many parts were scrapped, which shift ran slow. That reality lives in MES, machine controllers, historians, quality systems and, often, clipboards.
Because these systems don’t share IDs or timestamps, plant reports are stitched together by hand. The result:
- OEE that depends on who calculated it. Different plants exclude different stops from planned time.
- Downtime reasons that say “other.” Free-text codes no one can analyze.
- Scrap found at month-end, when the batch, shift and supplier are long gone.
- Cost per unit as an estimate, because actual labor, material and downtime arrive weeks after production.
- Late orders explained after the fact, not flagged while there is still time.
Which Manufacturing KPIs Belong in Power BI?
| KPI | What it tells you | Main sources |
|---|---|---|
| OEE | Availability × performance × quality, by line, shift and product | MES, machine counts, ERP schedule |
| Downtime | Planned vs unplanned stops, top reasons, MTBF and MTTR | MES, historian, maintenance system |
| Scrap, rework and yield | First-pass yield and scrap by line, shift, material and supplier | QMS, MES, ERP |
| Cost per unit | Actual vs standard, with labor, material and overhead variance | ERP, payroll, MES |
| On-time-in-full (OTIF) | Orders shipped on the promised date in full quantity | ERP, WMS, shipping |
| Schedule adherence | Planned vs actual output by line and day | ERP or APS, MES |
| Inventory | Days on hand, WIP, slow-moving and obsolete stock | ERP, WMS |
We write down each definition with your plant and finance leads first. For OEE that means agreeing what counts as planned time, ideal cycle time and a good part, so every plant calculates it the same way.
Which Systems Do We Connect?
- ERP: for example Microsoft Dynamics 365, SAP Business One, NetSuite, Epicor, Sage, Plex.
- MES: production counts, work orders, stop events and labor reporting.
- SCADA and historians: for example tag data exported from historians such as AVEVA PI or Ignition, collected through secure outbound connections.
- QMS: inspections, non-conformances, CAPA and supplier quality records.
- Maintenance (CMMS): work orders and asset history for downtime analysis.
- Spreadsheets: downtime logs, shift reports and budgets, moved into controlled tables.
Machine data arrives every second; reports don’t need that. We aggregate readings to useful intervals (for example 1 or 15 minutes) in a data warehouse before Power BI reads them, so dashboards stay fast and storage costs stay sensible.
What Does a Sample Manufacturing Dashboard Look Like?
Sample dashboard. Illustrative layout and data, not a client project.
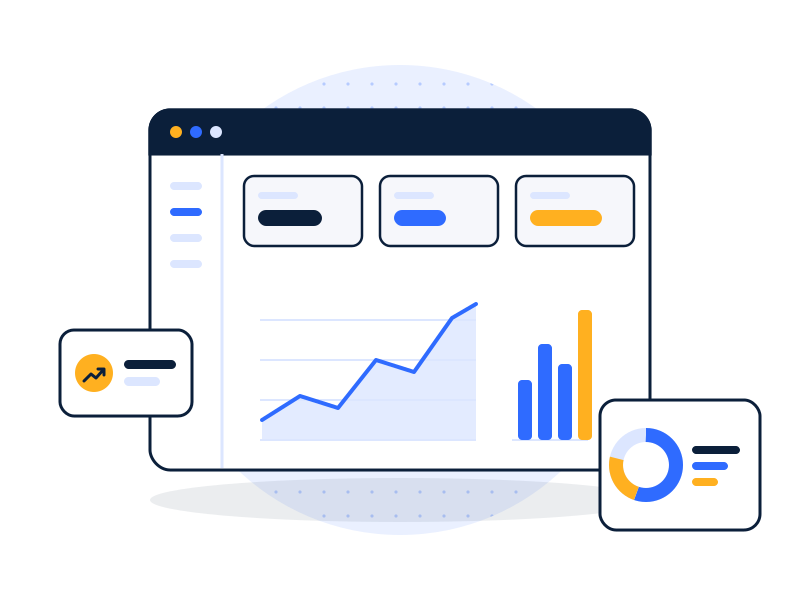
- Page 1, Plant overview: OEE, output, scrap % and OTIF for yesterday and week to date, by plant and line.
- Page 2, OEE breakdown: availability, performance and quality losses by line and shift, with drill-through to stop events.
- Page 3, Downtime: Pareto of stop reasons, MTBF and MTTR by asset, linked to maintenance work orders.
- Page 4, Quality: first-pass yield and scrap by product, material lot and supplier.
- Page 5, Cost and delivery: actual vs standard cost per unit, orders at risk of missing their ship date.
Supervisors get a large-screen floor view; leadership gets a one-page summary.
How Do We Keep Manufacturing Data Secure?
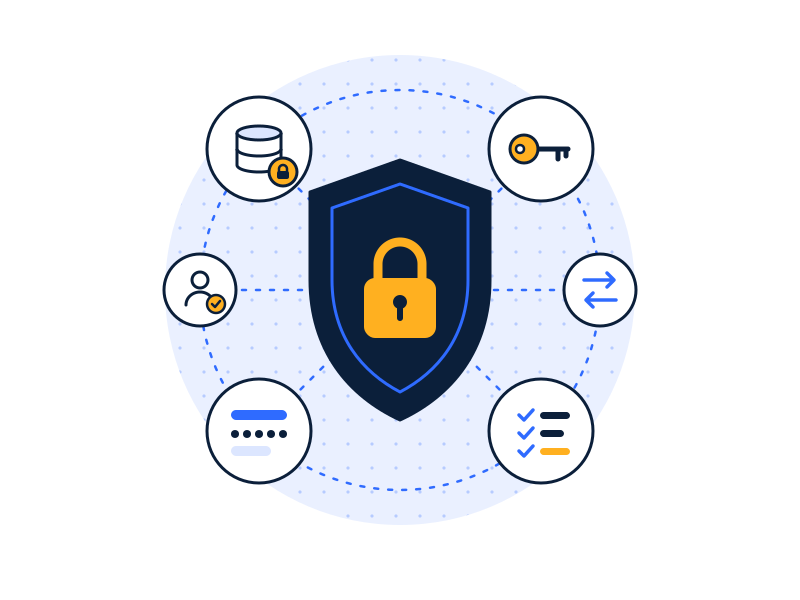
Manufacturing data includes costs, margins, supplier pricing, customer volumes and sometimes customer-owned designs. Plant systems also need protecting from the reporting layer.
- OT/IT separation. Plant networks connect through one-way gateways or secure outbound collectors. We never open control systems to the internet.
- Row-level security by plant, line and customer; supplier pricing visible only to procurement and finance.
- Least-privilege access through groups in Microsoft Entra ID, with multi-factor authentication enforced.
- Encryption at rest and in transit across pipelines, warehouse and Power BI.
- Audit logs of who viewed, exported or changed data and reports.
- Customer confidentiality. Data-sharing terms mapped to who can see which customer’s data.
HIPAA readiness. Some manufacturers handle protected health information, for example medical device makers with complaint or patient-linked service records. For that data we design to the HIPAA Security Rule’s technical safeguards (access control, audit controls, integrity, authentication and transmission security), keep PHI out of general dashboards, and de-identify where reporting doesn’t need it. Your organization remains responsible for HIPAA compliance; we build the controls that support it. See data security services.
How Does a Manufacturing Power BI Project Run?
- Audit. Map ERP, MES, machine, quality and maintenance data, and what is still on paper.
- Architect. OEE and cost definitions agreed with plant managers and finance; one product, line and asset hierarchy; security roles.
- Build & Secure. Pipelines, warehouse and Power BI model in weekly increments, with key numbers reconciled to source systems.
- Run & Improve. Refresh monitoring, training for supervisors and analysts, then optional support. Forecasting and anomaly alerts can follow once history builds up.
Related: manufacturing & logistics analytics · Power BI for logistics · Power BI consulting · business intelligence consulting · Microsoft Fabric consulting
FAQs
How is Power BI used in manufacturing?
Manufacturers use Power BI to track OEE, downtime, scrap and yield, cost per unit, inventory and on-time-in-full. Power BI connects to ERP, MES, historian, quality and maintenance data, usually through a data warehouse, and gives plant supervisors and leadership the same numbers at different levels of detail.
Can Power BI calculate OEE?
Yes. OEE is availability × performance × quality. Power BI calculates it from machine run and stop times, actual and ideal cycle times, and good versus total counts, usually from MES or machine data. The key is agreeing definitions first, such as planned downtime and ideal cycle time, so every plant reports OEE the same way.
Can Power BI show real-time machine data?
Power BI can show near-real-time data, but most plant decisions don’t need second-by-second readings. We usually aggregate machine data to one- or fifteen-minute intervals for dashboards. For true streaming use cases, Microsoft Fabric’s Real-Time Intelligence or a historian’s own tools are often a better fit, alongside Power BI.
Which ERPs and MES can you connect to Power BI?
Most of them. Power BI and common pipeline tools have connectors or APIs for ERPs such as Dynamics 365, SAP Business One, NetSuite and Epicor, and MES and historians can usually export through databases, APIs or files. We confirm feasibility for your specific systems during the audit.
Is it safe to connect plant systems to Power BI?
It is when the connection is designed properly. We keep plant networks separated from IT, use outbound-only collectors or one-way gateways, and never expose control systems to the internet. Reporting data is encrypted, access is least-privilege with MFA, and audit logs record who viewed or exported what.
OEE, Scrap and Cost per Unit Every Morning.
In a free 30-minute data audit we’ll map your ERP, MES and quality data and tell you what to connect first.