
Manufacturing analytics consulting helps manufacturers and logistics operators combine ERP, production, quality, warehouse, transport and sensor data to measure and improve output, cost and delivery. Hoist DigiSoft connects those systems into one secure warehouse and builds dashboards and forecasts for OEE, downtime, inventory, cost per unit and on-time delivery.
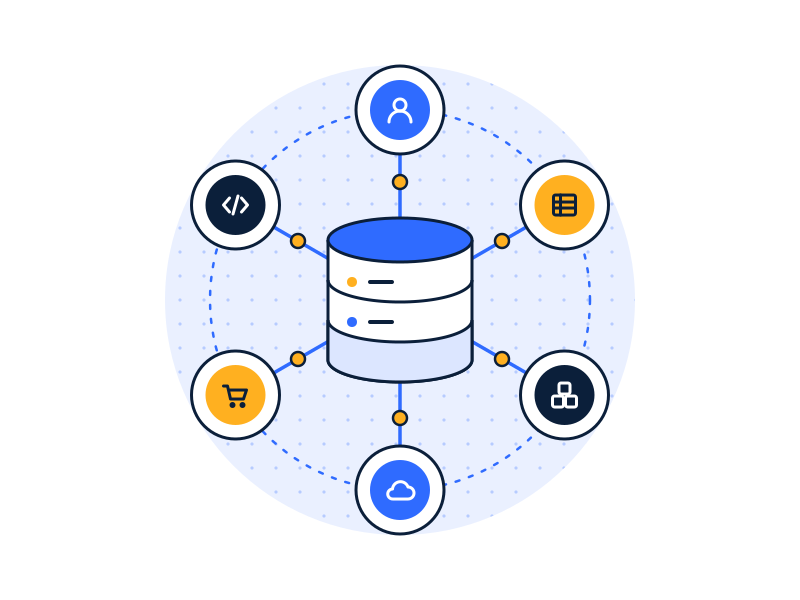
What are the data challenges in manufacturing and logistics?
Manufacturing
- The ERP knows the plan; the floor knows reality. Orders, BOMs and costs live in the ERP. Actual run times, stops and scrap live in MES, machine controllers or clipboards.
- Sensor data with nowhere to go. Machines and IoT devices produce readings every second, and most of it is never analyzed.
- Quality data apart from production. Defects are logged in a separate system, so linking them to shifts, lines or suppliers is manual.
- Cost per unit is a month-end estimate. Real labor, material and downtime costs come together too late to act on.
Logistics & supply chain
- Shipments split across systems. TMS, WMS, carrier portals and telematics each hold part of a shipment’s story.
- On-time delivery argued over. Promised, shipped and delivered dates come from different systems with different time zones.
- Inventory blind spots. Stock at plants, warehouses, in transit and at customers isn’t visible in one view.
- Carrier and cost data in spreadsheets. Freight invoices and accessorials are reconciled by hand.
Which systems do we connect?
- ERP: for example SAP Business One, Microsoft Dynamics 365, NetSuite, Epicor, Sage.- Production: MES, SCADA/historian exports, machine and PLC data through IoT gateways.
- Quality: QMS, inspection records, non-conformance logs.
- Warehouse and transport: WMS, TMS, carrier APIs, telematics and GPS.
- Planning and procurement: supplier portals, purchase orders, forecasts in spreadsheets.
High-frequency sensor data is aggregated before it reaches reporting tables, so dashboards stay fast and storage costs stay sensible. See data integration services and data warehouse consulting.
Which KPIs and dashboards do we build?
| Area | Example KPIs |
|---|---|
| Production | OEE (availability × performance × quality), throughput, schedule adherence |
| Downtime | Planned vs unplanned downtime, top stop reasons, mean time between failures, mean time to repair |
| Quality | Scrap and rework rate, first-pass yield, defects by line, shift and supplier |
| Cost | Actual cost per unit vs standard, labor and material variance |
| Inventory | Inventory turns, days on hand, stockouts, slow-moving and obsolete stock |
| Delivery | On-time in-full (OTIF), order cycle time, dock-to-stock time, dwell time |
| Transport | Cost per shipment, cost per mile/km, carrier on-time rate, freight invoice variance |
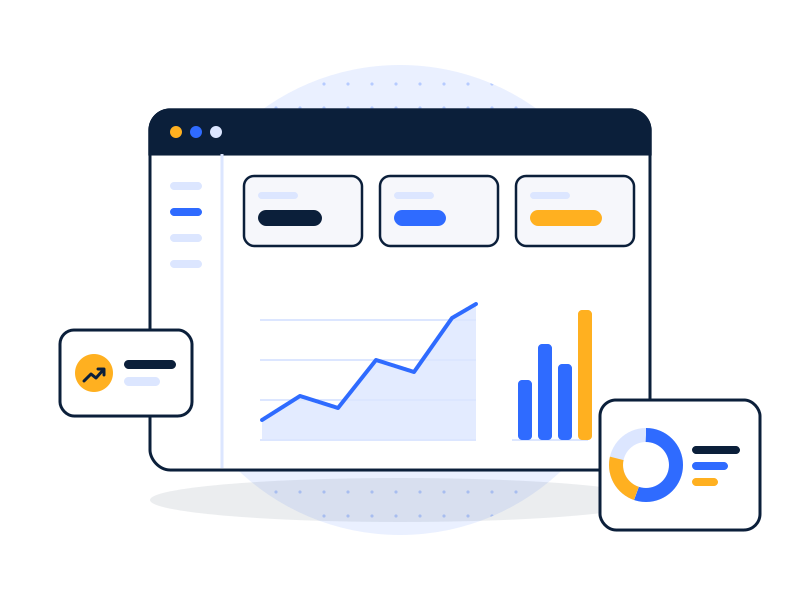
Dashboards run in Power BI, Tableau, Looker or Qlik, with a plant-floor view for supervisors and a summary view for leadership. See executive KPI dashboards.
Forecasting and anomaly detection. With ERP and production history in one place, we build demand forecasts for planning and inventory, and anomaly models that flag unusual sensor readings or scrap spikes for a person to review. See data mining & predictive analytics.
Process integration. Application integrations keep orders, shipments and inventory in step between ERP, WMS and customer or carrier systems. See ERP-to-CRM sync.
How do we handle compliance and security?
Manufacturing and logistics data is commercially sensitive: costs, margins, customer volumes, supplier pricing and sometimes customer-owned designs.
- Customer and supplier obligations. Data-sharing terms and confidentiality clauses mapped to who can see what.
- Segmented access. Plant, region and customer-level row security; supplier pricing visible only to procurement and finance.
- OT/IT separation. Plant-floor networks connected through one-way gateways or secure collectors, never by opening control systems to the internet.- Encryption and logging. At rest and in transit, with access logs.
More: data security and encryption.
What does a manufacturing data project look like?
Illustrative example. Not a client project.
A two-plant manufacturer runs Dynamics 365 for orders and costing, logs downtime on paper and spreadsheets, and ships through two 3PLs. Leadership can’t see OEE or OTIF without a week of spreadsheet work.
- Audit: map ERP, the downtime sheets, machine counters available through existing gateways, and 3PL exports.
- Architect: a warehouse with one product, line and customer hierarchy; OEE and OTIF definitions agreed with plant managers.
- Build & Secure: ERP and 3PL pipelines, a simple digital downtime log replacing paper, machine counts aggregated to 15-minute intervals; plant-level access control.
- Run & Improve: daily OEE and OTIF dashboards; demand forecast added for the top 50 SKUs.
Designed outcome: OEE and OTIF visible each morning, by plant and line.
Related services
FAQs
What is manufacturing analytics consulting?
Manufacturing analytics consulting is outside expertise to combine ERP, production, quality and sensor data and turn it into measures of output, cost and quality. Typical deliverables are a data warehouse, OEE and downtime dashboards, cost-per-unit reporting, and forecasting or anomaly models built on the combined data.
Can you use data from our machines and sensors?
Usually, yes. Machine and sensor data can come from MES, historians, PLCs or IoT gateways. We collect it through secure, outbound-only connections, aggregate high-frequency readings to useful intervals, and join it with ERP and quality data. Feasibility depends on your equipment, and we check it in the audit.
How do you measure on-time in-full (OTIF)?
OTIF is the share of orders delivered on the promised date with the full quantity. We calculate it from order, shipment and delivery records combined across ERP, WMS, TMS and carrier data, after agreeing with you which date counts as “promised” and how partial shipments are treated.
OEE, inventory and delivery in one view.
Book a free 30-minute data audit. We’ll map your ERP, production and logistics systems and tell you what to connect first.