
These are common data problems companies face, and how Hoist DigiSoft solves each one: a single source of truth, customer 360, automated reporting, executive dashboards, ERP-to-CRM sync, cloud migration, demand forecasting, encryption and key management, and access control with audit trails. Each links to the service that delivers it.
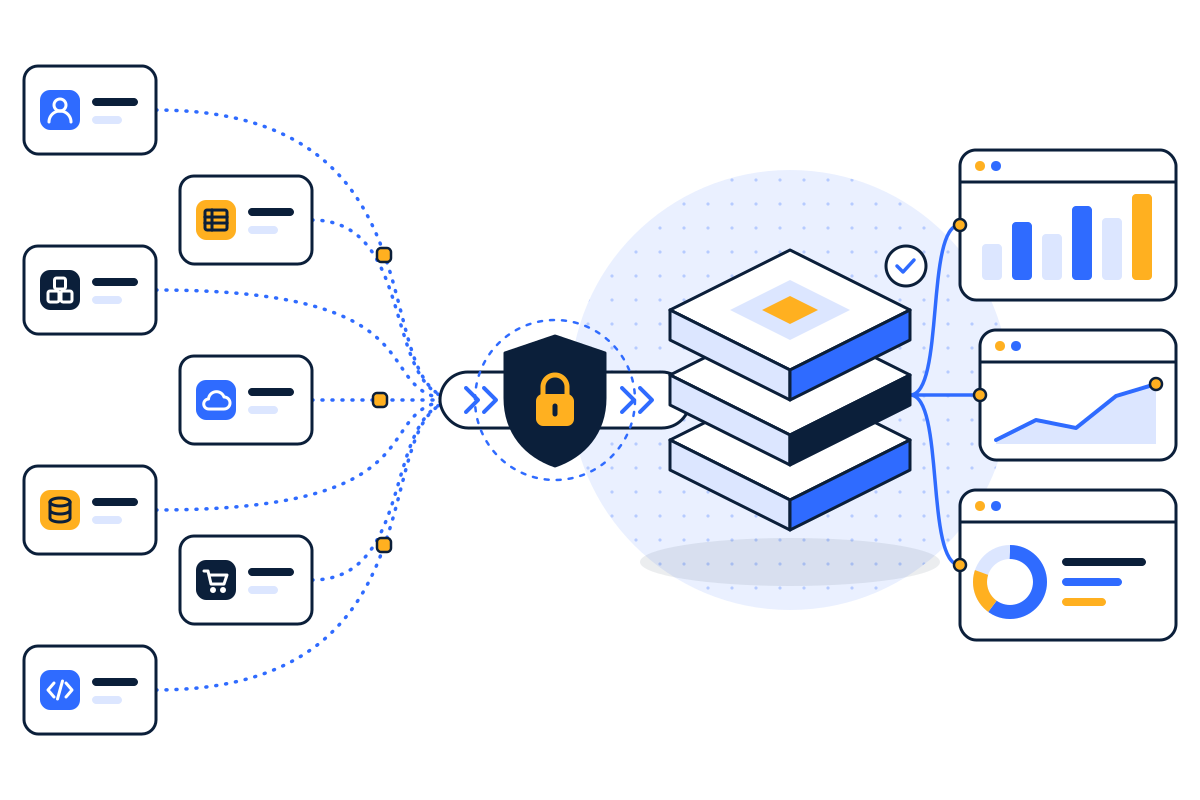
Jump to: Single source of truth · Customer 360 · Automated reporting · KPI dashboards · ERP-to-CRM sync · Cloud migration · Demand forecasting · Encryption & keys · Access control & audit trails · Small business analytics
Single source of truth for finance and operations
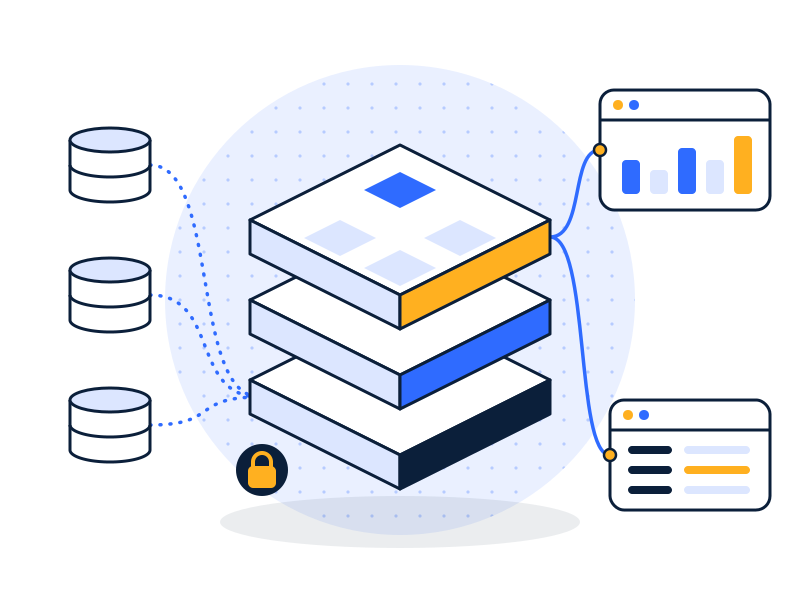
The problem. Finance, sales and operations each report “revenue” from a different system, and the leadership meeting starts with an argument about which number is right.
What “fixed” looks like. One governed database that every report reads from. Each metric has one definition and one owner. When two dashboards show revenue, they show the same revenue.
How we build it. Pipelines from each source into a data warehouse; customers, products and accounts matched across systems; metric definitions agreed with owners and written into a semantic layer; dashboards rebuilt on top.
Tools. Snowflake, BigQuery, Redshift, Microsoft Fabric or SQL Server; Fivetran or Azure Data Factory; dbt; Power BI, Tableau, Looker or Qlik.
Typical timeline. 6 to 12 weeks for the first three to five sources.
Delivered by: data integration services · Read more: how to consolidate data from multiple sources · single source of truth (glossary)
Customer 360
The problem. The same customer exists as separate records in the CRM, billing, support and ecommerce systems. Nobody can see their full history, revenue or open issues in one place.
What “fixed” looks like. One customer record with revenue, product usage, payment status, open tickets and contact history, visible in dashboards and pushed back into the CRM where account teams work.
How we build it. Matching rules (IDs, emails, domains, fuzzy names) approved by your team; a golden customer table in the warehouse; reverse ETL back to the CRM and support desk.
Tools. dbt for matching and modeling; Fivetran or custom API pipelines; your warehouse and CRM.
Typical timeline. 6 to 10 weeks.
Delivered by: data integration services · master data management (glossary)
Automated reporting that replaces spreadsheets
The problem. Someone spends hours every week exporting from three systems, pasting into Excel, fixing formulas and emailing a report that’s out of date by the time it’s read.
What “fixed” looks like. The same report, refreshed on a schedule from the source systems, delivered by link or subscription, with no manual steps and a clear alert if a refresh fails.
How we build it. We document the current spreadsheet logic, rebuild it in the warehouse and BI tool, run both side by side until the numbers match, then retire the spreadsheet.
Tools. Power BI, Tableau, Looker or Qlik; scheduled pipelines; dbt tests.
Typical timeline. 3 to 6 weeks per report family.
Delivered by: business intelligence consulting · Power BI consulting
Executive KPI dashboards
The problem. Leadership has to open five tools, or wait for a deck, to see how the business is doing.
What “fixed” looks like. One screen with the ten or so numbers that matter (revenue, margin, cash, pipeline, operations), each with a target, a trend and drill-through to the detail.
How we build it. We start with the decisions leaders make each week, agree the KPIs and targets, then build on a governed model so every number reconciles to source.
Tools. Power BI, Tableau, Looker or Qlik on your warehouse.
Typical timeline. 4 to 8 weeks, faster if the data is already centralized.
Delivered by: business intelligence consulting · Power BI consulting
ERP-to-CRM sync
The problem. Sales closes a deal in the CRM, and someone re-keys it into the ERP. Credit holds, invoices and payment status never make it back to sales.
What “fixed” looks like. Closed deals create customers and sales orders automatically; invoice and payment status flow back to the CRM; every sync is logged and failures alert a person.
How we build it. Field mapping agreed with sales and finance; API or iPaaS integration with retries, idempotency and an error queue; parallel run before switching off manual entry.
Tools. Native connectors, iPaaS or custom API integrations hosted in your cloud.
Typical timeline. 3 to 6 weeks.
Delivered by: application integration services
Legacy-to-cloud warehouse migration
The problem. Reporting runs on an aging on-premises database or appliance that’s slow, expensive to maintain and understood by one person.
What “fixed” looks like. A cloud data warehouse with full history moved across, reports repointed, numbers reconciled, and a rollback plan you never had to use.
How we build it. Inventory of tables, jobs and reports; target design; migration in waves; automated reconciliation of row counts and key totals; parallel running; planned cutover.
Tools. Snowflake, BigQuery, Redshift, Azure Synapse or Microsoft Fabric; Azure Data Factory, AWS Glue or Fivetran; dbt.
Typical timeline. 8 to 16 weeks depending on size and condition of the legacy system.
Delivered by: data warehouse consulting
Inventory and demand forecasting
The problem. Orders, staffing and purchasing are planned from last year’s spreadsheet and gut feel, leading to stockouts on some lines and dead stock on others.
What “fixed” looks like. A forecast by product and location, refreshed weekly, that accounts for seasonality, promotions and lead times, with forecast accuracy tracked against actuals.
How we build it. Clean sales and inventory history in the warehouse first; baseline the current method; build and test models on held-out history; deliver forecasts into planning dashboards or the ERP.
Tools. Python-based models on your warehouse; Power BI, Tableau or Looker for planners.
Typical timeline. 6 to 10 weeks once history is centralized.
Delivered by: data mining & predictive analytics
Encryption at rest and in transit, plus key management
The problem. You’re not sure whether every database, export, backup and connection is encrypted, or who controls the keys.
What “fixed” looks like. Every store of data encrypted at rest, every connection encrypted in transit, sensitive fields masked or tokenized, and keys held in your own key management service with rotation and logged use.
How we build it. Discovery of where data lives and moves; gap list ranked by risk; staged fixes tested so nothing breaks; documentation for your auditors.
Tools. Azure Key Vault, AWS KMS, Google Cloud KMS; native warehouse encryption and masking.
Typical timeline. 3 to 8 weeks.
Delivered by: data security & encryption · Glossary: encryption at rest · key management
Access control and audit trails
The problem. Former staff still have access, shared logins exist, whole datasets are shared with everyone, and nobody could say who viewed what last month.
What “fixed” looks like. Access through SSO with MFA, role-based and row-level security, scheduled access reviews, and audit logs showing who accessed which data and when.
How we build it. Map roles to data; implement RBAC in the warehouse and BI tools; remove shared and stale accounts; turn on and retain audit logging; set up a quarterly review.
Tools. Microsoft Entra ID, Okta or Google Workspace for SSO; native warehouse and BI security features.
Typical timeline. 3 to 6 weeks.
Delivered by: data security & encryption
Data analytics for small and mid-sized businesses
The problem. You’re too big for spreadsheets and too small for a data team. Enterprise-scale projects feel like overkill.
What “fixed” looks like. One clean data source and one dashboard that answers the question you ask every week, built so you can add more later without starting over.
How we build it. Start with the single most painful report; connect only the systems it needs; use managed tools that don’t need a full-time engineer to run; document everything.
Tools. Usually Power BI (often already in your Microsoft 365 plan) with a small cloud warehouse or SQL database.
Typical timeline. 3 to 6 weeks for a first dashboard.
Delivered by: business intelligence consulting · data integration services
Which industries use these?
Every use case above applies across sectors. See how they play out in healthcare, retail & ecommerce, manufacturing & logistics, real estate and other industries.
FAQs
What is a data use case?
A data use case is a specific business problem solved with data, such as automating a weekly report or forecasting demand. Starting from a use case, rather than a technology, keeps a project focused on a result someone needs, and makes it easier to judge whether the work paid off.
Which use case should we start with?
Start with the use case that costs the most time or causes the most disagreement today, as long as the data for it exists. For many companies that’s a single source of truth or automated reporting, because it also lays the foundation for dashboards, forecasting and integrations later.
Can you combine several use cases in one project?
Yes. Use cases share foundations: a single source of truth makes dashboards, forecasting and customer 360 faster to build. We usually deliver one use case first so you see value early, then reuse the same pipelines and warehouse for the next ones.
Recognize your problem here?
Book a free 30-minute data audit and we’ll tell you which use case to start with and what it would take.