
Real estate data analytics combines property management, leasing, accounting and building-system data so owners and operators can see occupancy, rent collection, NOI and asset performance in one place. Hoist DigiSoft connects those systems into a secure data warehouse and builds portfolio, property and leasing dashboards that refresh on their own.
What are the data challenges in real estate?
Real estate businesses run on a stack that grew one property, one fund or one acquisition at a time:
- Several property management systems. Acquisitions bring their own system, chart of accounts and unit naming.
- Leasing and CRM data apart from operations. Leads and tours in one tool, signed leases in another, maintenance in a third.
- Accounting by entity. Each property or SPV has its own books, so portfolio reporting means consolidating by hand.
- Building data nobody uses. Access control, energy meters and IoT sensors generate data that never reaches a decision.
- Investor reporting by spreadsheet. Quarterly packs rebuilt from exports, with the risk of a number that doesn’t match the books.
The result is a portfolio view that’s always a few weeks old and never quite agreed.
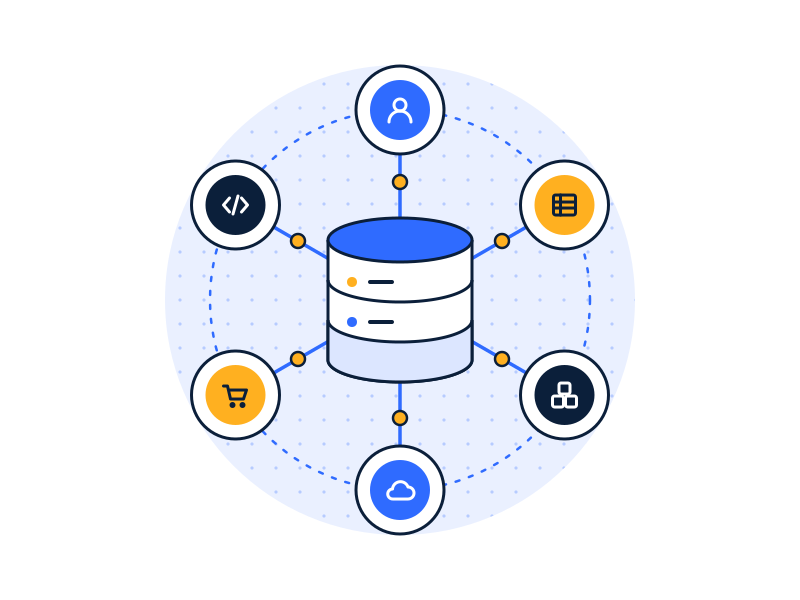
Which systems do we connect?
- Property management and accounting platforms (for example Yardi, AppFolio, RealPage, MRI or Entrata), plus general ledgers like NetSuite, Sage Intacct, QuickBooks or Xero.- Leasing and CRM: lead sources, tours, applications and renewals.
- Maintenance and work-order tools.
- Building systems: access control, utility meters, occupancy and environmental sensors.
- Market and budget data: budgets, forecasts and third-party comps kept in spreadsheets today.
We load them into a data warehouse with one property and unit hierarchy, so “Building 4, Unit 210” means the same thing in every system. See data integration services.
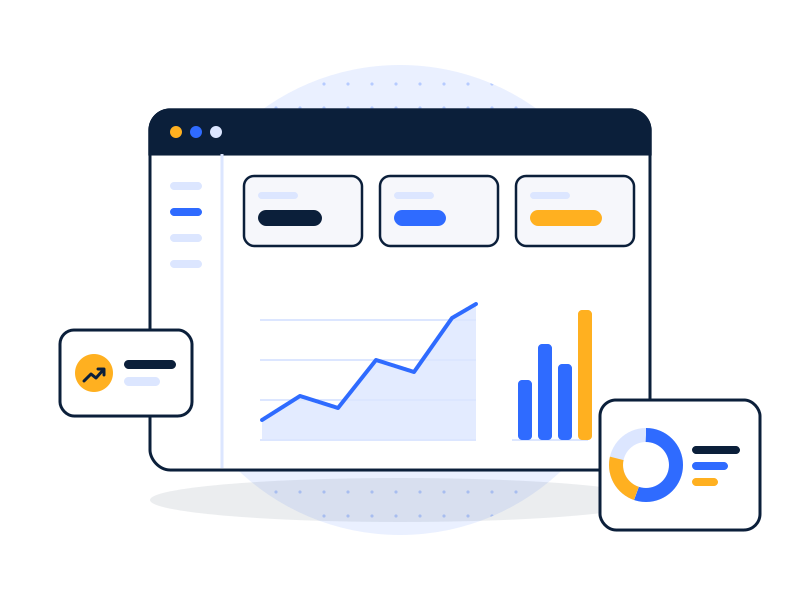
Which KPIs and dashboards do we build?
| Dashboard | Example KPIs |
|---|---|
| Portfolio overview | Occupancy (physical and economic), NOI vs budget, rent roll, debt service coverage |
| Leasing | Leads to tours to applications to leases, days vacant, renewal rate, lease expiry profile |
| Collections | Rent collected vs billed, delinquency by aging bucket, concessions |
| Operations | Work orders open and closed, time to resolve, cost per unit, unit turn time |
| Building performance | Energy and utility use per square foot, sensor-based space utilization |
| Investor reporting | Fund and property performance on agreed definitions, refreshed from the books |
Dashboards are built in Power BI, Tableau, Looker or Qlik, with drill-down from portfolio to property to unit. See executive KPI dashboards.
Forecasting. With a few years of history in one place, predictive models can forecast occupancy, renewals and delinquency risk, so asset managers act before the numbers move.
How do we handle compliance and security?
Real estate data includes tenant personal information: names, contact details, payment history, sometimes identity and income documents. We design around that:
- tenant personal data excluded or masked in analytics unless a role needs it;
- encryption at rest and in transit, keys held in your cloud account;
- row-level security so property managers see their properties, asset managers their funds, and investors only their own reporting;
- access logging for audit and investor due diligence.
We design to the privacy rules where you operate, such as state privacy laws (including CCPA in California) in the US, PIPEDA in Canada and the Privacy Act 1988 in Australia. More: data security and encryption.
What does a real estate data project look like?
Illustrative example. Not a client project.
An operator with 40 multifamily properties runs two property management systems after an acquisition, plus a separate CRM for leasing. Monthly portfolio reporting takes a week.
- Audit: map both systems’ property and unit codes; list the 15 KPIs in the monthly pack.
- Architect: one warehouse, one property/unit hierarchy, agreed definitions for occupancy and NOI.
- Build & Secure: pipelines from both systems and the CRM; tenant identifiers excluded from reporting tables; row-level security by region.
- Run & Improve: daily refresh; the monthly pack produced from the same model.
Designed outcome: a portfolio view that’s current every morning and matches the books.
Related services
FAQs
What is real estate data analytics?
Real estate data analytics is the practice of combining property, leasing, financial and building data to measure and predict portfolio performance. It covers KPIs like occupancy, rent collection, NOI, lease expiry and operating cost, and it lets owners and operators compare properties on the same definitions instead of separate spreadsheets.
Can you combine data from two property management systems?
Yes. Combining two property management systems is a common integration project after an acquisition. We load both into one data warehouse, map their property, unit and account codes to a single hierarchy, and agree definitions like occupancy with your team, so portfolio reports treat every property the same way.
Can building and IoT data be included?
Yes. Building and IoT data, such as access control, utility meters and occupancy sensors, can be loaded into the same warehouse as financial and leasing data. That lets you report energy cost per square foot or space utilization alongside revenue, and spot buildings that cost more to run than they should.
Your whole portfolio, current every morning.
Book a free 30-minute data audit. We’ll map your property, leasing and finance systems and tell you what it takes to see them in one place.