
Power BI for logistics combines data from your TMS, WMS, ERP, telematics and accounting systems into dashboards that show where you make and lose money. Hoist DigiSoft builds the pipelines, the data model and secure Power BI reports for margin per route and customer, empty miles, on-time delivery, cost per shipment and warehouse throughput.
Why Is Logistics Reporting So Hard to Get Right?
A single shipment touches five or six systems. The order sits in the ERP. The load and carrier are in the TMS. Picking and dock times are in the WMS. The truck’s real route and idle time are in telematics. Fuel, driver pay and freight invoices land in accounting weeks later.
Each system answers its own question well. None of them answers “did we make money on that lane last month?” So the answer gets built by hand in a spreadsheet, usually too late to change anything.
Common symptoms:
- Revenue is known per load, cost isn’t. Fuel, tolls, driver pay and accessorials are booked at company level, not against the load or route.
- On-time delivery is argued over. Promised, appointment and delivered times come from different systems in different time zones.
- Empty miles are a guess. Telematics records every mile, but nobody joins it to loaded legs.
- Warehouse and transport are reported separately, so dock delays never show up as late deliveries.
Which Logistics KPIs Belong on a Power BI Dashboard?
| KPI | What it tells you | Main sources |
|---|---|---|
| Margin per route, lane and customer | Revenue minus allocated fuel, driver, tolls, accessorials and carrier cost | TMS, accounting, telematics |
| Empty miles (deadhead %) | Share of miles driven without a load | Telematics, TMS load legs |
| On-time delivery (OTD) and OTIF | Deliveries on the promised date, and in full | ERP orders, TMS, proof of delivery |
| Cost per shipment, mile or pallet | Unit cost trend by lane, mode and carrier | Accounting, TMS, freight invoices |
| Dock-to-stock and order cycle time | Speed from receipt to available, order to ship | WMS, ERP |
| Warehouse throughput | Lines, units or pallets per hour by shift and zone | WMS, labor management |
| Carrier scorecard | On-time rate, damage claims, invoice variance by carrier | TMS, claims log, accounting |
| Dwell and detention | Time at shipper and receiver beyond free time | Telematics geofences, TMS |
We agree each definition with your operations and finance leads before building it. “On time” alone can have three meanings.
Which Systems Do We Connect?
- TMS: for example McLeod, MercuryGate, Oracle Transportation Management, or your own system.
- WMS: for example Manhattan, Blue Yonder, NetSuite WMS or Dynamics 365 warehouse management.
- ERP: Microsoft Dynamics 365, NetSuite, SAP Business One, Sage, Epicor.
- Telematics and ELD: for example Samsara, Motive or Geotab, through their APIs.
- Accounting and invoices: QuickBooks, Xero, Sage, plus carrier invoice files.
- Spreadsheets: rate sheets, budgets and manual logs, moved into controlled tables.
Where there are more than two or three sources, we load them into a data warehouse first. Power BI then reads one clean model instead of six raw systems. Telematics pings are aggregated to trip and stop level so reports stay fast.
What Does a Sample Logistics Dashboard Look Like?
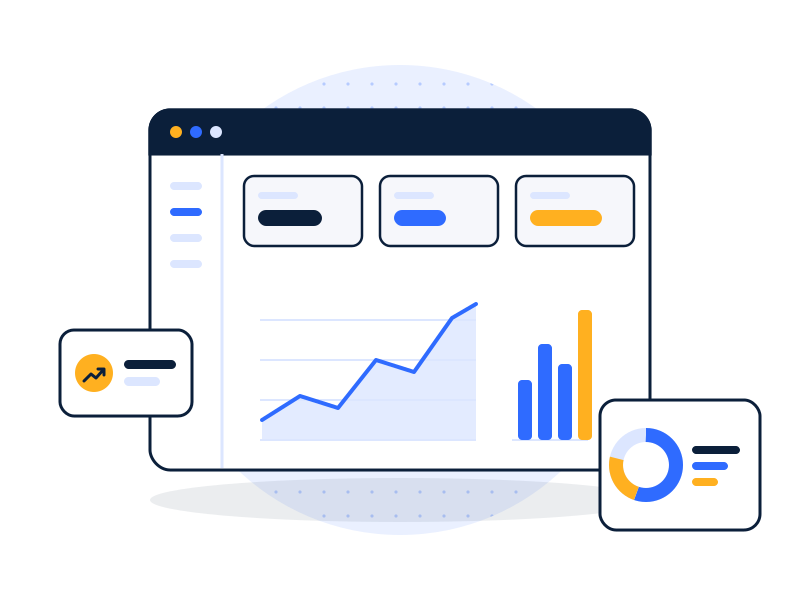
Sample dashboard. Illustrative layout and data, not a client project.
- Page 1, Network overview: revenue, margin %, on-time delivery and empty miles for the week, with a map of lanes colored by margin.
- Page 2, Lane and customer profitability: margin per lane and customer, drill-through to individual loads and their cost breakdown.
- Page 3, Fleet: empty miles by driver and terminal, idle time, dwell at top facilities.
- Page 4, Warehouse: dock-to-stock time, throughput per hour by shift, orders at risk of missing cutoff.
- Page 5, Carriers: scorecard for brokered and partner carriers.
Dispatchers get a mobile view; leadership gets one page with drill-through.
How Do We Keep Logistics Data Secure?
Logistics data is commercially sensitive: customer rates, carrier costs, lane margins and driver locations. Some of it is personal data too.
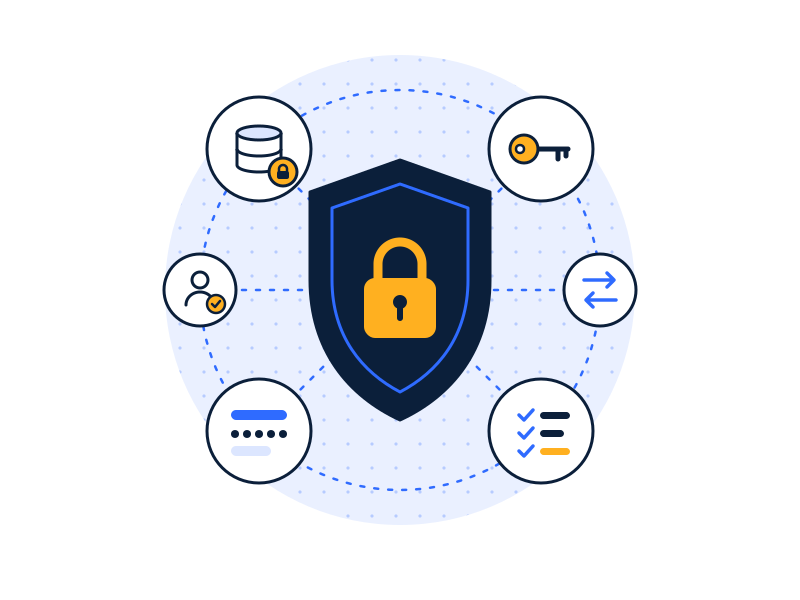
- Row-level security. Customer service sees their accounts, terminal managers see their terminal, and lane margins are limited to finance and leadership.
- Least-privilege access through groups in Microsoft Entra ID, with multi-factor authentication enforced.
- Encryption at rest and in transit, across pipelines, warehouse and Power BI.
- Driver privacy. GPS data is aggregated to trips and stops for reporting; raw location history stays restricted.
- Audit logs of who viewed, exported or changed reports and data.
- Export and sharing controls so rate sheets don’t leave the company in a spreadsheet.
HIPAA readiness. Some logistics data includes protected health information, for example pharmacy, home medical equipment or lab specimen deliveries with patient names and addresses. For those flows we design to the HIPAA Security Rule’s technical safeguards (access control, audit controls, integrity, authentication and transmission security), keep PHI out of general dashboards, and de-identify where reports don’t need it. Your organization remains responsible for HIPAA compliance; we build the controls that support it. See data security services.
How Does a Logistics Power BI Project Run?
- Audit. Map your TMS, WMS, ERP, telematics and accounting data, and how costs are booked today.
- Architect. KPI definitions, cost allocation rules for margin per load, and security roles.
- Build & Secure. Pipelines, warehouse and Power BI model in weekly increments, with key numbers reconciled to source systems.
- Run & Improve. Refresh monitoring, training for dispatch, warehouse and finance teams, then optional support.
Related: manufacturing & logistics analytics · Power BI for manufacturing · Power BI consulting · business intelligence consulting
FAQs
Can Power BI be used for logistics?
Yes. Power BI is widely used for logistics reporting. It can connect to TMS, WMS, ERP, telematics and accounting data, directly or through a data warehouse, and show KPIs such as on-time delivery, cost per shipment, empty miles and lane margin. The hard part is the data model and cost allocation, not the charts.
What should a logistics dashboard include?
A logistics dashboard should include the few KPIs that drive profit and service: margin per lane and customer, on-time delivery or OTIF, cost per shipment or mile, empty miles, dwell time and warehouse throughput. Each KPI needs an agreed definition and an owner, plus drill-through to the loads behind the number.
How do you calculate margin per route?
Margin per route is load revenue minus the costs of running it: fuel, driver pay, tolls, accessorials, carrier cost and a share of fixed costs. Many costs are booked at company level, so we agree allocation rules with finance, such as by miles or hours, then apply them consistently in the data model.
How do you measure empty miles?
Empty miles are the miles a truck drives without a load. We calculate them by joining telematics trip data to loaded legs from the TMS. Any distance between a delivery and the next pickup counts as empty. The result is shown as a percentage of total miles by driver, terminal and lane.
Is our customer and driver data safe in Power BI?
It can be, with the right setup. We use Microsoft Entra ID sign-in with MFA, group-based least-privilege access, row-level security, encryption and audit logs. Rates and margins are limited to the roles that need them, and raw GPS history stays restricted while dashboards show aggregated trips.
See Margin by Lane, Not Just Revenue.
In a free 30-minute data audit we’ll map your TMS, WMS, telematics and accounting data and tell you what to connect first.