
By Hoist DigiSoft Data Team · Last updated 2026-11-04
To consolidate data from multiple sources, you extract data from each system (CRM, ERP, accounting, spreadsheets), load it into one central database such as a cloud data warehouse, standardize formats, match duplicate records, and define each business metric once. Automated pipelines keep it fresh. The result is a single source of truth every report and app can read.
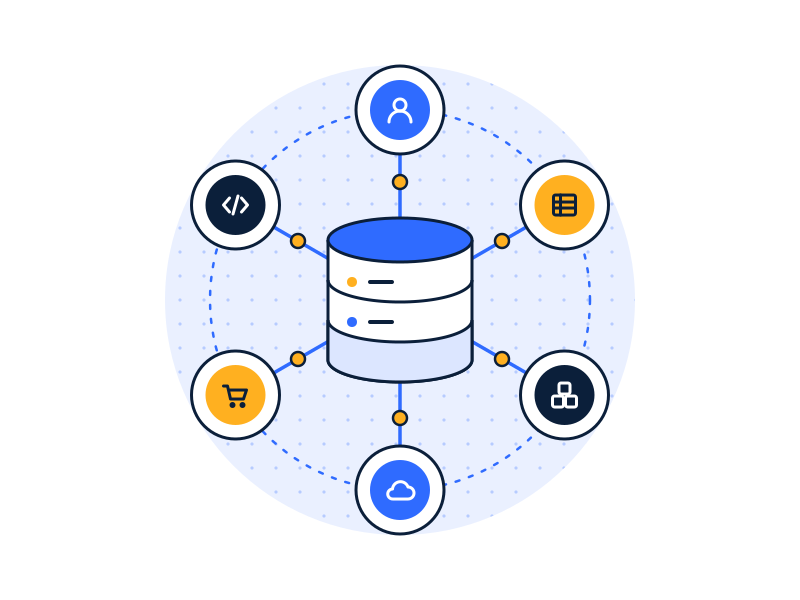
Why is consolidating data so hard?

Every system you buy was designed to do its own job well, not to agree with the others. Your CRM calls them “accounts”, your accounting system calls them “customers”, and your support desk knows them by email address. Each has its own IDs, date formats, currencies and idea of what a “closed” deal is.
The scale of the problem is well documented in large organizations. MuleSoft’s 2025 Connectivity Benchmark Report, based on a survey of more than 1,050 IT leaders, found the average enterprise manages 897 applications, and only 29% of them are integrated. Mid-sized companies run fewer apps, but usually with no data team to connect them, so the work falls on finance or operations staff with a spreadsheet.
The cost shows up as errors and lost time. Gartner estimates poor data quality costs organizations an average of $12.9 million a year. And it blocks what comes next: in the same MuleSoft survey, 80% of IT leaders cited data integration as their most significant obstacle, and 95% reported challenges integrating AI into existing processes.
If you want the full service view, our data integration services page covers how we approach this end to end. This post is the practical version: the options, the steps and the traps.
What are the ways to consolidate data from multiple sources?
There are five common approaches. They aren’t equally good, but each has a place.
| Approach | How it works | Good for | Breaks down when |
|---|---|---|---|
| Manual spreadsheets | Export from each system, paste into Excel or Google Sheets, reconcile by hand | One-off analysis; very small teams | You need it weekly, more than two sources, or more than one person relies on it |
| BI tool connects to each source | Power BI, Tableau or Looker pulls from each system directly and joins them in the report | Two or three clean sources, modest volumes | Joins get complex, history is lost, reports slow down, each report re-implements logic |
| App-to-app sync (iPaaS or APIs) | Systems push records to each other so they stay in step | Operational processes like CRM-to-ERP order flow | You need history, analysis across many systems, or one place to report from |
| Central data warehouse + pipelines (ELT) | Pipelines load every source into one warehouse; transformations clean, match and model the data | Most mid-sized companies wanting trusted reporting, history and room to grow | Rarely; it’s more upfront work than the options above |
| Data virtualization | A query layer reads sources live without copying data | Large enterprises with strict rules against copying data | Sources are slow, APIs are rate-limited, or you need history |
For most companies with three or more systems, the warehouse approach is the right default. It’s the only option on the list that gives you history, one set of business rules and a place that both dashboards and apps can read from. The rest of this post assumes it. See data warehouse and single source of truth in our glossary.
How do you consolidate data into one database, step by step?
1. List every source and who owns it
Write down every system that holds data you report on: CRM, ERP, accounting, ecommerce, support, HR, marketing tools, and the spreadsheets people actually use. For each, note the owner, roughly how much data it holds, how often it changes and whether it contains sensitive information.
Don’t skip the spreadsheets. The “unofficial” stock sheet or commission tracker often holds the business rules nobody wrote down.
2. Start from the questions, not the systems
Pick the three to five questions leadership asks most often. “What’s our margin by customer?” “How many active customers do we have?” These tell you which sources and fields you need first. Consolidating everything at once is how projects stall.
3. Choose where the data will live
For most mid-sized companies this is a cloud data warehouse: Snowflake, Google BigQuery, AWS Redshift, Microsoft Fabric or Azure Synapse. If you’re a Microsoft shop with moderate volumes, SQL Server can be enough. Choose based on the cloud you already use and your team’s skills. Our data warehouse consulting page compares them.
Build it in your own cloud account so the data stays in your environment.
4. Build pipelines from each source
Use managed connectors where they exist (Fivetran, Azure Data Factory, AWS Glue, native warehouse connectors) and write custom code only for systems without one. Load raw data first, unchanged. This is the ELT pattern, and keeping the raw copy makes every later fix easier.
| ETL | ELT | |
|---|---|---|
| Transform happens | Before loading | After loading, in the warehouse |
| Raw data kept | Often not | Yes |
| Best fit | Sensitive fields must be dropped before landing | Most cloud warehouse builds |
5. Standardize formats
Convert dates to one format and time zone, currencies to one reporting currency, units to one standard, and codes (country, state, product category) to one list. Do this in version-controlled transformations, typically with dbt, so every change is reviewed and repeatable.
6. Match records that describe the same thing
This is the step that makes consolidation worth doing. Match customers across CRM, billing and support; products across ecommerce, ERP and the warehouse system.
- Exact matches first: shared IDs, tax numbers, email addresses.
- Then rule-based fuzzy matches: normalized company names, domains, addresses.
- Then human review for anything uncertain.
Your team should approve the matching rules. The output is one “golden record” per customer or product. This is the core of master data management.
7. Define each metric once
Agree on definitions with the people who own them: what counts as revenue, an active customer, a closed deal. Write each definition into the warehouse models and the BI tool’s semantic layer, so every dashboard calculates it the same way. Expect this to take longer than the technical work. It’s also where most of the value is.
8. Test, secure and monitor
- Reconcile: compare warehouse totals to source systems and finance’s numbers before anyone relies on a dashboard.
- Test every load: row counts, duplicates, nulls, freshness and business rules.
- Secure it: encrypt data at rest and in transit, give each pipeline a read-only account with only the access it needs, store credentials in a key vault, and log access. Consolidated data is more valuable to an attacker than data spread across ten systems. See data security services.
- Monitor: alert a named person when a pipeline fails, the same day.
How long does it take to consolidate data from multiple sources?
It depends on the number of sources, their condition and how quickly definitions get agreed. Typical ranges for a mid-sized company:
| Scope | Typical first-phase timeline |
|---|---|
| 2 to 3 clean SaaS sources, a few core metrics | 4 to 6 weeks |
| 3 to 5 sources including an ERP, customer matching | 6 to 12 weeks |
| Legacy on-premises database migration plus new sources | 8 to 16 weeks |
These are typical ranges, not guarantees. Messy source data and slow decisions on definitions are the most common reasons projects run long.
What mistakes should you avoid?
- Consolidating everything first. Start with the sources that answer your top questions. Add the rest in phases.
- Skipping the raw layer. If you transform before loading and get a rule wrong, you have to reload from source.
- Leaving matching to the BI tool. Joining on names inside a dashboard produces duplicates you won’t notice for months.
- No owner for definitions. If nobody owns “active customer”, it will drift back to three definitions within a year.
- Security at the end. Encryption, access control and logging are cheap to build in and expensive to retrofit.
- No monitoring. A silent pipeline failure means a confident dashboard showing last Tuesday’s data.
What does “done” look like?
You know consolidation has worked when:
- leadership uses one dashboard and nobody brings their own spreadsheet to the meeting;
- the same metric returns the same number in every report;
- a new question takes hours to answer, not a week;
- clean data flows back into the tools people use, through reverse ETL or integrations;
- you can say who has access to what, and prove it.
From there, the same foundation supports executive KPI dashboards, customer 360 and forecasting. If you’re weighing whether to do it in-house or with help, read what business intelligence consulting includes.
FAQs
What is the best way to combine data from multiple systems?
The best way to combine data from multiple systems is usually a central data warehouse fed by automated pipelines. Each source is loaded raw, then standardized, matched and modeled in one place. This keeps history, applies business rules once, and gives every report and app the same numbers.
Can I consolidate data without a data warehouse?
Yes, for small cases. With two or three clean sources and modest volumes, a BI tool like Power BI can connect to each directly and join them. Beyond that, reports slow down, history is lost and logic gets duplicated, which is when a data warehouse becomes the cheaper option.
What is a unified database?
A unified database is a single database that holds consistent, matched data from several business systems, with shared IDs and definitions. It’s usually a cloud data warehouse. Reports, dashboards, predictive models and apps all read from it, so they agree with each other.
How do you keep consolidated data secure?
Consolidated data is kept secure with encryption at rest and in transit, least-privilege access for every user and pipeline, credentials stored in a key vault, masking of sensitive fields, and audit logging. Building inside your own cloud account keeps the data in your environment.
Want a second opinion on your sources before you start? Book a free 30-min data audit · Centralize my data