
Business intelligence (BI) consulting is expert help to collect a company’s data, model it, and present it as dashboards and reports people trust. Hoist DigiSoft’s BI consultants design the KPI framework, connect your sources, build the semantic model, and train your team, so decisions run on one version of the numbers.
What is business intelligence consulting?
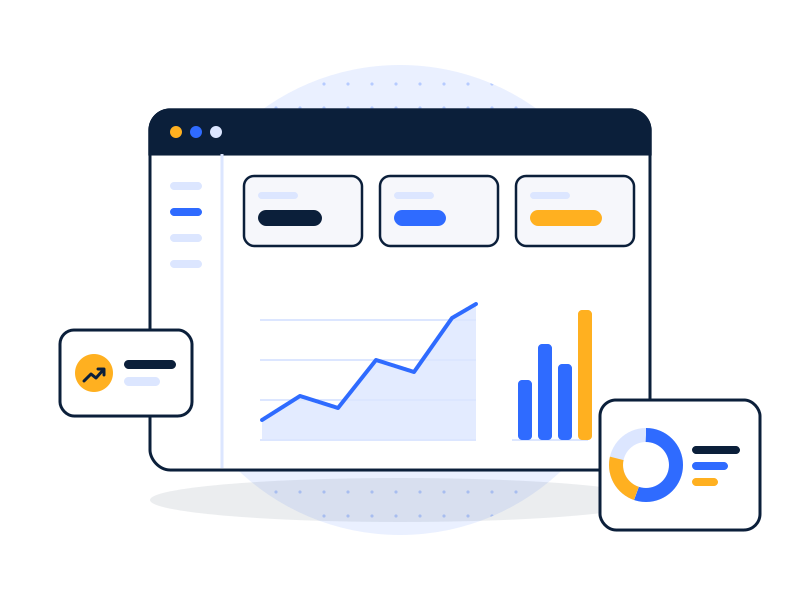
Business intelligence is the practice of turning raw business data into information people use to decide things: dashboards, scheduled reports, alerts and self-serve analysis. BI consulting is outside help to plan and build that, usually because the internal team is too busy running the business to rebuild its reporting.
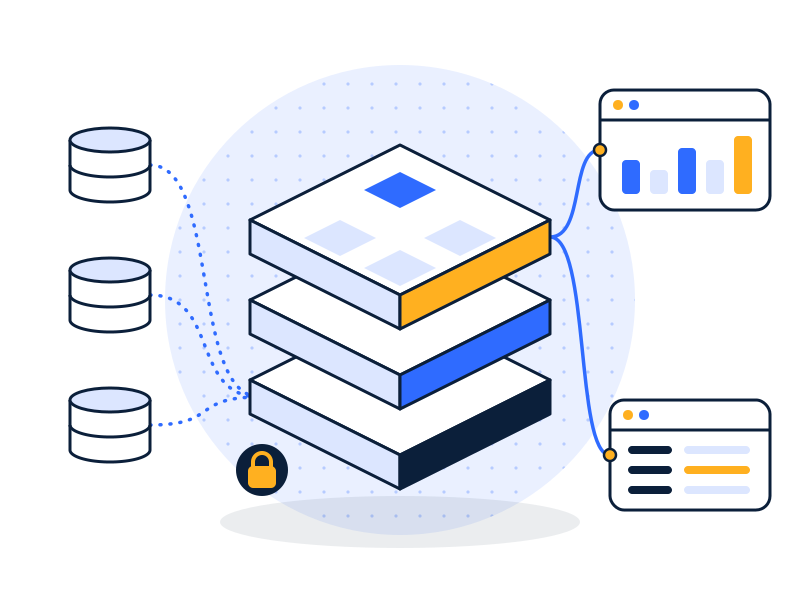
A good BI project has four layers, and most failed ones skip at least one:
- Sources. The systems where data is created: CRM, ERP, accounting, ecommerce, HR, support tools and spreadsheets.
- Storage and pipelines. Moving that data somewhere central and keeping it fresh. For most mid-sized companies this is a data warehouse fed by integration pipelines.
- The model. Business rules written down once: what “revenue”, “active customer” and “gross margin” mean. This is the semantic layer.
- Presentation. Dashboards and reports in a tool such as Power BI, Tableau, Looker or Qlik.
Most companies start at layer 4 and wonder why the dashboards disagree. The fix is almost always in layers 2 and 3.
What are the signs you need a BI consulting company?
You don’t need a consultant because you have data. You need one when the data is costing you time or trust. The common signs:
- Excel sprawl. Critical reports live in spreadsheets with copy-pasted data, hidden tabs and formulas only one person understands.
- Conflicting numbers. Sales, finance and operations bring different figures for the same metric to the same meeting.
- Slow month-end. Closing the books or producing the board pack takes days of manual reconciliation.
- Dashboards nobody opens. You bought a BI tool, built some reports, and usage dropped after a month.
- Questions that take a week. “Which customers grew last quarter and what did they buy?” needs an analyst and a few days.
- A single point of failure. One person knows how the reporting works, and their vacation is a risk.
If three or more of these are true, a BI project is worth scoping. The free data audit tells you which ones matter most.
What do our BI consulting services include?
We cover the full BI lifecycle. You can hire us for one piece or all of it.
BI strategy and KPI framework
We interview leadership and department heads, list the decisions they make each week, and work backward to the metrics those decisions need. You get a KPI catalog: each metric’s definition, owner, source system and refresh frequency.
Data modeling
We design the data model that sits under your dashboards, usually a star schema with fact tables (orders, invoices, tickets) and dimension tables (customers, products, dates). Good models make reports fast and make wrong numbers hard to produce.
Dashboard and report development
We build executive, departmental and operational dashboards. Every dashboard has a stated audience and a stated question it answers. If it doesn’t, we don’t build it.
Data governance
Who owns each metric, who can see which rows, how changes get approved, and how you know the data is fresh. We set up row-level security, certified datasets and a simple change process that a mid-sized team can actually follow.
Training and handover
We train report users and the people who will maintain the model, and we leave documentation in plain English. You should be able to run without us.
How does BI save money and improve operations?
BI saves money in three places, and only one of them is obvious.
- Hours. Every report that refreshes on its own is time handed back to finance, sales ops and analysts.
- Errors. Gartner estimates poor data quality costs organizations an average of $12.9 million a year. Mid-sized companies won’t hit that number, but the mechanism is the same: wrong numbers lead to wrong orders, wrong pricing and wasted spend.
- Speed of decisions. When the weekly numbers are ready Monday at 8am instead of Thursday afternoon, problems can be fixed days earlier.
We don’t promise a return figure before we’ve seen your data. In the audit we estimate hours spent on manual reporting with you, which is usually the clearest business case.
Which BI tools do we work with?
We work with:
- Power BI (and Microsoft Fabric)
- Tableau
- Looker (Google Cloud)
- Qlik
Under them, we work with Snowflake, Google BigQuery, AWS Redshift, Azure Synapse, SQL Server, dbt, Fivetran, Azure Data Factory and AWS Glue.
We’re tool-neutral by default. If you already own a BI tool, we’ll usually make it work rather than replace it. If you’re choosing from scratch, we’ll recommend based on your existing licenses (many companies already pay for Power BI through Microsoft 365), your team’s skills and your data platform.
| Tool | Usually a good fit when | Watch out for |
|---|---|---|
| Power BI | You run on Microsoft 365 or Azure; you want broad self-serve use | Licensing rules for sharing; model design matters a lot |
| Tableau | Analysts need deep visual exploration | Cost per user can add up; governance needs planning |
| Looker | You’re on Google Cloud/BigQuery and want a code-defined semantic layer | Needs LookML skills to maintain |
| Qlik | You have existing Qlik investment or need its associative engine | Smaller talent pool in some markets |
How do we work?

- Audit
- Architect
- Build & Secure
- Run & Improve
- Audit (weeks 1 to 2). We review your current reports, sources and access. You get a findings document and a recommended first scope.
- Architect (weeks 2 to 3). KPI catalog, data model design and access rules, agreed with metric owners.
- Build & Secure (weeks 3 to 8). Pipelines, model and the first set of dashboards, shown to you every week, with encryption and row-level security built in. Before go-live we reconcile dashboard numbers against your source systems and your finance team’s figures.
- Run & Improve. Rollout, training and documentation, then optional ongoing support for changes, new dashboards and monitoring.
Timelines are typical ranges for a first scope, not promises.
Security runs through every step: encrypted connections to every source, least-privilege service accounts and row-level security in the BI tool. See data security and encryption.
How do you choose among BI consulting companies?
An honest checklist. Use it on us too.
- Do they start with your decisions or with a tool? If the first meeting is a product demo, be careful.
- Will they write down metric definitions? Without a KPI catalog, you’re buying dashboards that will drift.
- Who will actually do the work? Ask for the named lead and their hands-on experience with your BI tool.
- How do they validate numbers? Ask how they reconcile dashboards against your source systems.
- Where does your data go? Ask whether they build in your cloud account, how access is granted, and how it’s revoked.
- What happens after launch? Documentation, training and who maintains the model.
- Can they do the plumbing? A BI firm that can’t build pipelines or a warehouse will hand you dashboards on top of a mess.
For a longer version, read what business intelligence consulting includes.
What does a BI project look like?
Illustrative example. Not a client project.
A 200-person professional services firm reports utilization from its time-tracking tool, revenue from QuickBooks and pipeline from HubSpot. Each department head builds their own spreadsheet.
- Audit: we find four definitions of “billable utilization” in use.
- Define: leadership agrees one definition and one owner.
- Build: pipelines from all three tools into a warehouse, a star-schema model and three dashboards (firm, practice, individual).
- Govern: row-level security so practice leads see their practice; partners see everything.
Result to aim for: one utilization number, refreshed daily, that nobody has to rebuild by hand.
Where does BI fit in your industry?
BI questions change by sector. See how we approach healthcare, retail and ecommerce, manufacturing and logistics and real estate, or browse all industries.
Common use cases: single source of truth · automated reporting · executive KPI dashboards
FAQs
What does a BI consultant do?
A BI consultant designs and builds the systems that turn company data into reliable reports. That includes agreeing KPI definitions with leaders, connecting data sources, building a data model, creating dashboards, setting access rules and training users. A good consultant also checks that dashboard numbers reconcile with source systems before anyone relies on them.
Should we use BI consulting or hire an in-house BI analyst?
BI consulting brings a team with modeling, pipeline, dashboard and security skills for a defined build, which one hire rarely covers. An in-house analyst is better for steady, ongoing questions. Many mid-sized companies do both: consultants build the foundation, then a single internal analyst maintains and extends it.
How long does a BI implementation take?
A first BI scope, such as two or three connected sources and a handful of dashboards, typically takes six to ten weeks. Larger rollouts across many departments run in phases over several months. The biggest variables are data quality in your source systems and how quickly metric owners agree on definitions.
What is a semantic layer?
A semantic layer is the part of a BI system that translates database tables into business terms, such as “revenue” or “active customer”, with one agreed calculation each. Every dashboard reads from it, so the same metric always returns the same number. In Power BI it’s the semantic model; in Looker it’s LookML.
Can you work with our existing tools?
Yes. We usually build on the BI tool, database and cloud you already pay for. We work with Power BI, Tableau, Looker and Qlik, and with Snowflake, BigQuery, Redshift, Azure Synapse, Microsoft Fabric and SQL Server underneath. We only recommend switching if your current tool genuinely blocks what you need.
One version of the numbers, for every team.
Book a free 30-minute data audit. We’ll look at how your reports are built today and tell you what we’d fix first.